
The following data records the outputs of the Enterprise Zones programme since its inception in April 2012 to June 2016.
These data are self-reported on a quarterly basis by local areas and have not been validated. Data collection arrangements are kept under close review and steps are being taken to improve data quality. Data are checked prior to release and efforts have been made to ensure its accuracy. Updated data from previous quarters is included where available.
12 new Zones were established in April 2016 and this is the first quarterly report to include data for these new Zones. Please note that this creates a discontinuity in the EZ data series. The addition of new Zones also affects some sub-sets of data more than others (i.e. as the number and impact of adding new Zone data to a smaller group of EZs is potentially greater).
In this quarter, returns from 10 of the 36 Enterprise Zones in the programme were incomplete or not submitted by the due date. No adjustments have been made to account for Enterprise Zones not reporting information, so these data are likely to under-report the jobs, companies and private investment across all Enterprise Zones.
The table below shows data for Enterprise Zones in England for the period April 2012 – March 2016 and April 2012 – June 2016.
National Data[1]
| April 2012 – March 2016 | April 2012 – June 2016 | Numerical Change | % Change (rounded) | |
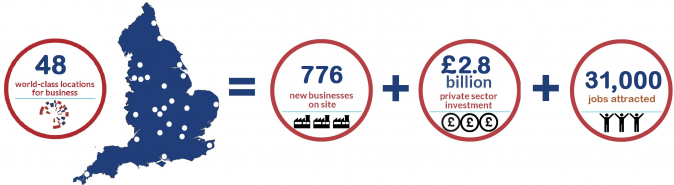
| Jobs | 29,549 | 31,794 | 2,245 | 8% |
| Companies | 732 | 776 | 44 | 6% |
| Private Sector Investment (£ millions) | 2,661 | 2,812 | 151 | 6% |
The tables below show a sub-national breakdown of Enterprise Zones data for the period April 2012 – March 2016 and April 2012 – June 2016.
North
The 14 Enterprise Zones in the North since April 2016 are: Daresbury; Humber; Lancashire; Leeds; Mersey Waters; Manchester Airport; Sheffield; North East; Tees Valley; Blackpool Airport (2016 start); Carlisle Kingmoor Park(2016 start); Cheshire Science Corridor(2016 start); Corridor Manchester (2016 start); and Hillhouse Chemicals and Energy (2016 start).
| April 2012 – March 2016 | April 2012 – June 2016 | Numerical Change | % Change (rounded) | |
| Jobs | 8,830 | 9,287 | 457 | 5% |
| Companies | 199 | 215 | 16 | 8% |
| Private Sector Investment (£ millions) | 1,329 | 1,339 | 10 | 1% |
Midlands
The 8 Enterprise Zones in the Midlands since April 2016 are: Birmingham, Black Country, Hereford, MIRA, Northampton, Nottingham, Ceramic Valley (2016 start) and Luton Airport (2016 start).
| April 2012 – March 2016 | April 2012 – June 2016 | Numerical Change | % Change (rounded) | |
| Jobs | 9,061 | 9,709 | 648 | 7% |
| Companies | 120 | 127 | 7 | 6% |
| Private Sector Investment (£ millions) | 1,152 | 1,283 | 131 | 11% |
South West.
The 3 Enterprise Zones in the southwest are: Newquay, Bristol and Oceansgate (2016 start).
| April 2012 – March 2016 | April 2012 – June 2016 | Numerical Change | % Change (rounded) | |
| Jobs | 4,632 | 4,850 | 218 | 5% |
| Companies | 172 | 181 | 9 | 5% |
| Private Sector Investment (£ millions) | 45 | 45 | 0 | 0% |
South East and London
The 7 Enterprise Zones in London and the South East are; Harlow, Discovery Park, Science Vale Oxford, Royal Docks London, Solent, Aylesbury Vale (2016 start) and the Didcot Growth Accelerator (2016 start).
| April 2012 – March 2016 | April 2012 – June 2016 | Numerical Change | % Change (rounded) | |
| Jobs | 4,527 | 4,952 | 425 | 9% |
| Companies | 182 | 192 | 10 | 5% |
| Private Sector Investment (£ millions) | 84 | 88 | 4 | 5% |
East of England
The 4 Enterprise Zones in the East of England are: Alconbury, New Anglia, Cambridge Compass (2016 start) and Space to Innovate (2016 start).
| April 2012 – March 2016 | April 2012 – June 2016 | Numerical Change | % Change (rounded) | |
| Jobs | 2,499 | 2,996 | 497 | 20% |
| Companies | 59 | 61 | 2 | 3% |
| Private Sector Investment (£ millions) | 50 | 56 | 6 | 12% |
The table below shows data for Enterprise Zones based in predominantly in rural areas for the period April 2012 – March 2016 and April 2012 – June 2016.
With the launch of new Zones in April 2016, the total number of Enterprise Zones in predominantly rural areas as defined by DEFRA has increased to 14. These are Alconbury; Newquay; Hereford; Lancashire; MIRA; Science Vale; Daresbury; Ceramics Valley (2016 start); Lancashire Hillhouse (2016 start); Cheshire and Warrington (2016 start); Space2Innovate (2016 start); Aylesbury Vale (2016 start); Cambridge Compass (2016 start); and Didcot Growth Accelerator (2016 start).
| April 2012 – March 2016 | April 2012 – June 2016 | Numerical Change | % Change (rounded) | |
| Jobs | 5,122 | 5,981 | 859 | 17% |
| Companies | 178 | 187 | 9 | 5% |
| Private Sector Investment (£ millions) | 155 | 163 | 8 | 5% |
[1] Figures may not sum due to rounding