
The following data records outputs of the Enterprise Zones programme as self-reported by local areas on a quarterly basis. The data is not validated but all efforts have been made to ensure its accuracy. The national and regional totals reflect some under-reporting. Returns from 7 of the 24 areas in the programme were incomplete or not submitted by the due date. Updated data will be included in future releases.
The table below shows current and previous quarter data for the periods:
April 2012 – March 2015 and April 2012 – June 2015
The next publication of Enterprise Zone data will cover July – September and be released in the new year 2016.
National Data [1]
| Previous quarter January – March 2015 | Current quarter April – June 2015 | Numerical increase | % increase [2] (rounded) |
|
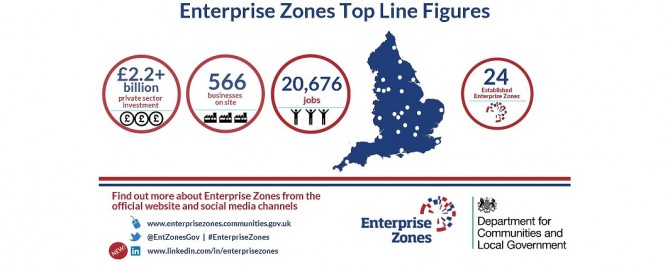
| Jobs | 18,949 | 20,676 | 1,727 | 9% |
| Companies | 540 | 566 | 26 | 5% |
| Private Sector Investment (£ millions) |
2,224 | 2,265 | 41 | 2% |
Regional Data
Please see below for a split of the above National Enterprise Zone data by region [3]
| North | |||
| Previous quarter January – March 2015 | Current quarter April – June 2015 | % Change (rounded) | |
| Jobs | 5,125 | 5,889 | 15% |
| Companies | 139 | 150 | 8% |
| Private Sector Investment (£ millions) |
1,100 | 1,120 | 1.8% |
| Midlands | |||
| Previous quarter January – March 2015 | Current quarter April – June 2015 | % Change (rounded) | |
| Jobs | 6,501 | 6,969 | 7% |
| Companies | 85 | 88 | 4% |
| Private Sector Investment (£ millions) |
1,000 | 1,000 | 0% |
| South West | |||
| Previous quarter January – March 2015 | Current quarter April – June 2015 | % Change (rounded) | |
| Jobs | 2,663 | 3,083 | 18% |
| Companies | 118 | 127 | 8% |
| Private Sector Investment (£ millions) |
45.1 | 45.15 | 0.1% |
| South East and London | |||
| Previous quarter January – March 2015 | Current quarter April – June 2015 | % Change (rounded) | |
| Jobs | 3,670 | 3,715 | 1% |
| Companies | 151 | 154 | 2% |
| Private Sector Investment (£ millions) |
68.2 | 68.2 | 0% |
| East of England | |||
| Previous quarter January – March 2015 | Current quarter April – June 2015 | % Change (rounded) | |
| Jobs | 990 | 1,020 | 3% |
| Companies | 47 | 47 | 0% |
| Private Sector Investment (£ millions) |
35.30 | 35.70 | 1.13% |
Rural Zones
There are currently 7 Enterprise Zones based predominantly in rural areas [4], according to DEFRA definitions.
| Previous quarter January – March 2015 | Current quarter April – June 2015 | % Change (rounded) | |
| Rural Jobs | 3,156 | 3,749 | 19% |
[1] The data returns have been checked prior to release but, given all data are self-reported, it is difficult to ensure standards and robustness across EZs. Data collection arrangements are kept under close review and steps are being taken to improve them wherever possible
[2] See footnote 1 above on limitations of this data source
[3] 9 zones in the North are: Daresbury, Humber, Lancashire, Leeds, Liverpool, Manchester, Sheffield, North East, Tees, 6 in the Midlands: Birmingham, Black Country, Hereford, MIRA, Northampton, Nottingham, 2 in the southwest: Newquay, Bristol, 5 in the South East; Harlow, Discovery Park, Science Vale Oxford, Royal Docks London, Solent), 2 in the East of England: Alconbury, New Anglia
[4] Alconbury, Newquay, Hereford, Lancashire, MIRA, Science Vale, Daresbury