
EZ Data Release 09.11.2016
The following data records the outputs of the Enterprise Zones programme since its inception, in April 2012, to March 2016.
These data are reported on a quarterly basis. The last data release was on 27 July 2016 and covered the period to December 2015.
These data are self-reported by local areas and have not been validated. Data collection arrangements are kept under close review and steps are being taken to improve data quality. Data are checked prior to release and efforts have been made to ensure its accuracy. Updated data from previous quarters is included where available. In this quarter, returns from eight of the 24 Enterprise Zones in the programme were incomplete or not submitted by the due date. No adjustments have been made to account for Enterprise Zones not reporting information, so these data are likely to under-report the jobs, companies and private investment across all Enterprise Zones.
The next publication of Enterprise Zone data will cover the period to June 2016 and will be released in the first quarter of 2017. This will include data for 12 new Zones that were established in April 2016.
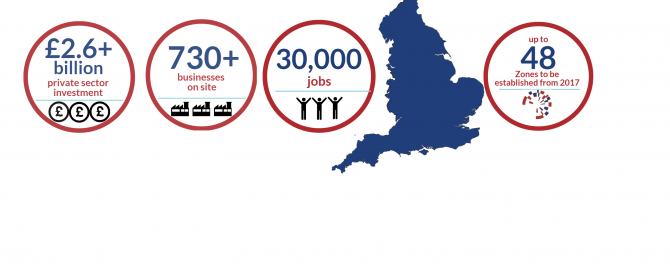
The table below shows data for Enterprise Zones in England for the period April 2012 – December 2015 and April 2012 – March 2016.
National Data[1]
| April 2012 – December 2015 | April 2012 – March 2016 | Numerical Change | % Change (rounded) | |
| Jobs | 26,452 | 29,549 | 3,097 | 12% |
| Companies | 703 | 732 | 29 | 4% |
| Private Sector Investment (£ millions) | 2,566 | 2,661 | 95 | 4% |
The tables below show a sub-national breakdown of Enterprise Zones data for the period April 2012 – December 2015 and April 2012 – March 2016.
North
The 9 Enterprise Zones in the North are: Daresbury, Humber, Lancashire, Leeds, Liverpool, Manchester, Sheffield, North East and Tees Valley.
| April 2012 – December 2015 | April 2012 – March 2016 | Numerical Change | % Change (rounded) | |
| Jobs | 8,018 | 8,830 | 812 | 10% |
| Companies | 194 | 199 | 5 | 3% |
| Private Sector Investment (£ millions) | 1,326 | 1,329 | 3 | 0% |
Midlands
The 6 Enterprise Zones in the Midlands are: Birmingham, Black Country, Hereford, MIRA, Northampton and Nottingham.
| April 2012 – December 2015 | April 2012 – March 2016 | Numerical Change | % Change (rounded) | |
| Jobs | 8,154 | 9,061 | 907 | 11% |
| Companies | 110 | 120 | 10 | 9% |
| Private Sector Investment (£ millions) | 1,073 | 1,152 | 79 | 7% |
South West.
The 2 Enterprise Zones in the southwest are: Newquay and Bristol.
| April 2012 – December 2015 | April 2012 – March 2016 | Numerical Change | % Change (rounded) | |
| Jobs | 3,965 | 4,632 | 667 | 17% |
| Companies | 169 | 172 | 3 | 2% |
| Private Sector Investment (£ millions) | 45 | 45 | 0 | 0% |
South East and London
The 5 Enterprise Zones in London and the South East are; Harlow, Discovery Park, Science Vale Oxford, Royal Docks London and Solent.
| April 2012 – December 2015 | April 2012 – March 2016 | Numerical Change | % Change (rounded) | |
| Jobs | 4021 | 4,527 | 506 | 13% |
| Companies | 171 | 182 | 11 | 6% |
| Private Sector Investment (£ millions) | 73 | 84 | 11 | 15% |
East of England
The 2 Enterprise Zones in the East of England are: Alconbury and New Anglia.
| April 2012 – December 2015 | April 2012 – March 2016 | Numerical Change | % Change (rounded) | |
| Jobs | 2,294 | 2,499 | 205 | 9% |
| Companies | 59 | 59 | 0 | 0% |
| Private Sector Investment (£ millions) | 49 | 50 | 1 | 2% |
The table below shows data for Enterprise Zones based in predominantly in rural areas for the period April 2012 – December 2015 and April 2012 – March 2016.
The 7 Enterprise Zones in predominantly rural areas as defined by DEFRA are Alconbury, Newquay, Hereford, Lancashire, MIRA, Science Vale and Daresbury.
| April 2012 – December 2015 | April 2012 – March 2016 | Numerical Change | % Change (rounded) | |
| Jobs | 4,917 | 5,122 | 205 | 4% |
| Companies | 170 | 178 | 8 | 5% |
| Private Sector Investment (£ millions) | 147 | 155 | 8 | 5% |
[1] Figures may not sum due to rounding